Background
New York City is special in that it has a rich history of immigration and diverse racial composition. Starting at the beginning of the 18th century, New York City has been the main port of entry for immigrants coming into the United States in search of asylum, new opportunities, and prosperity.
This trend of immigrant influx continued through the post-war economic boom of the 1950s and contributed to the rise of local ethnic businesses in New York. That spirit of immigrant entrepreneurship continues to this day.
Development
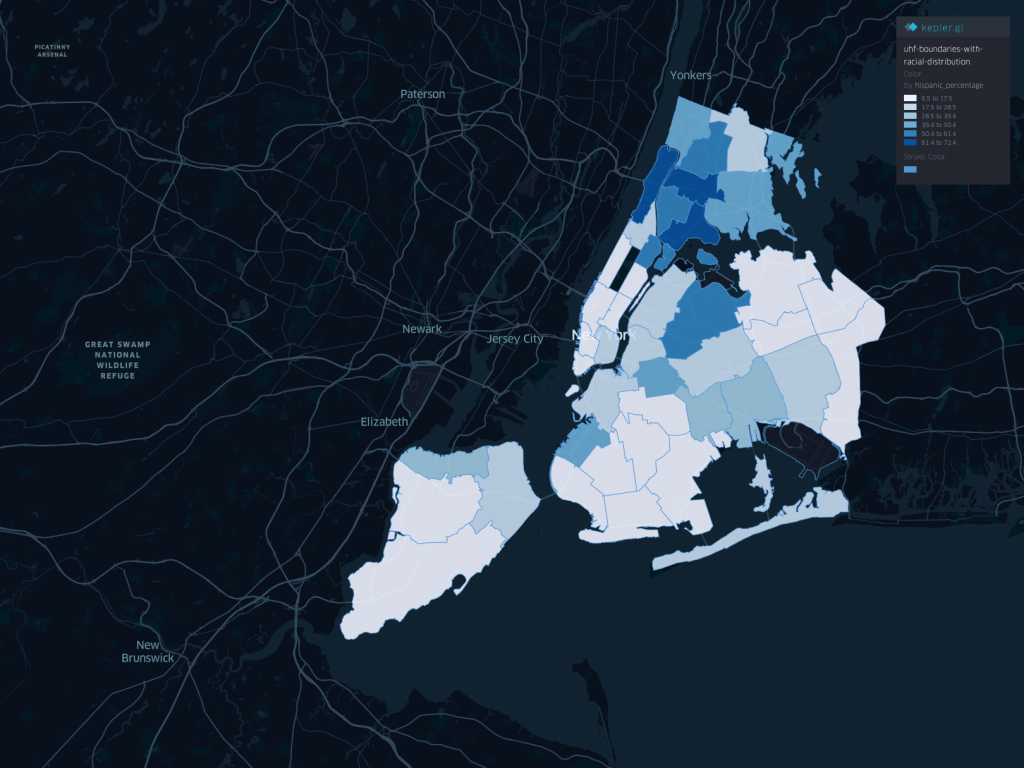
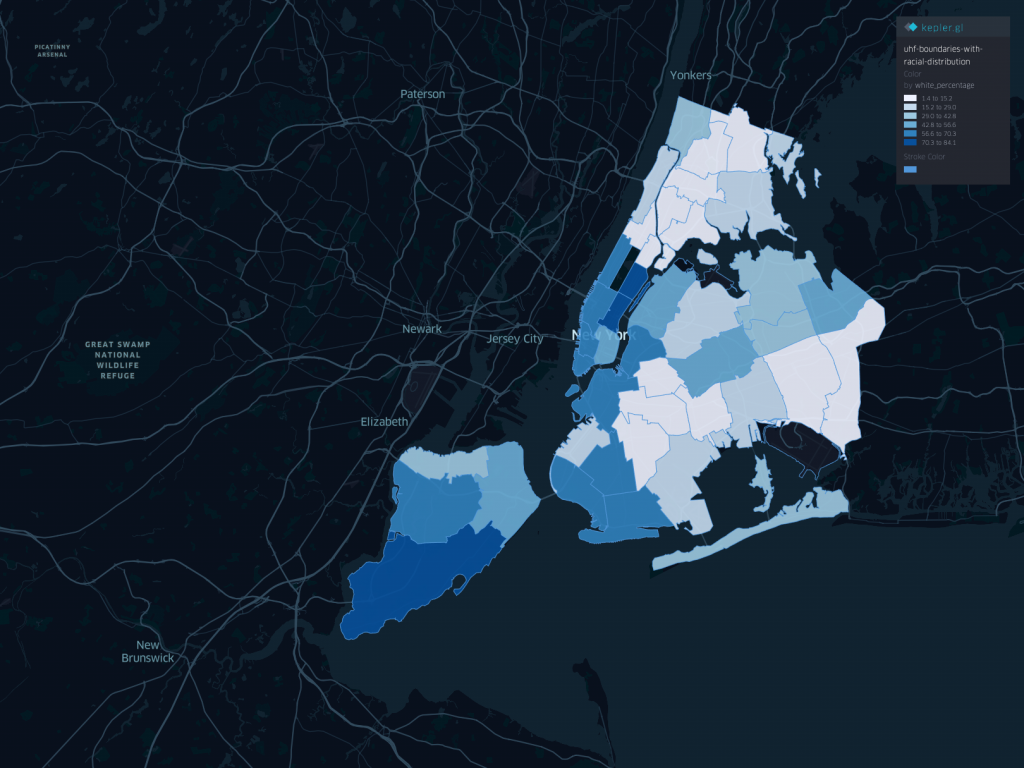
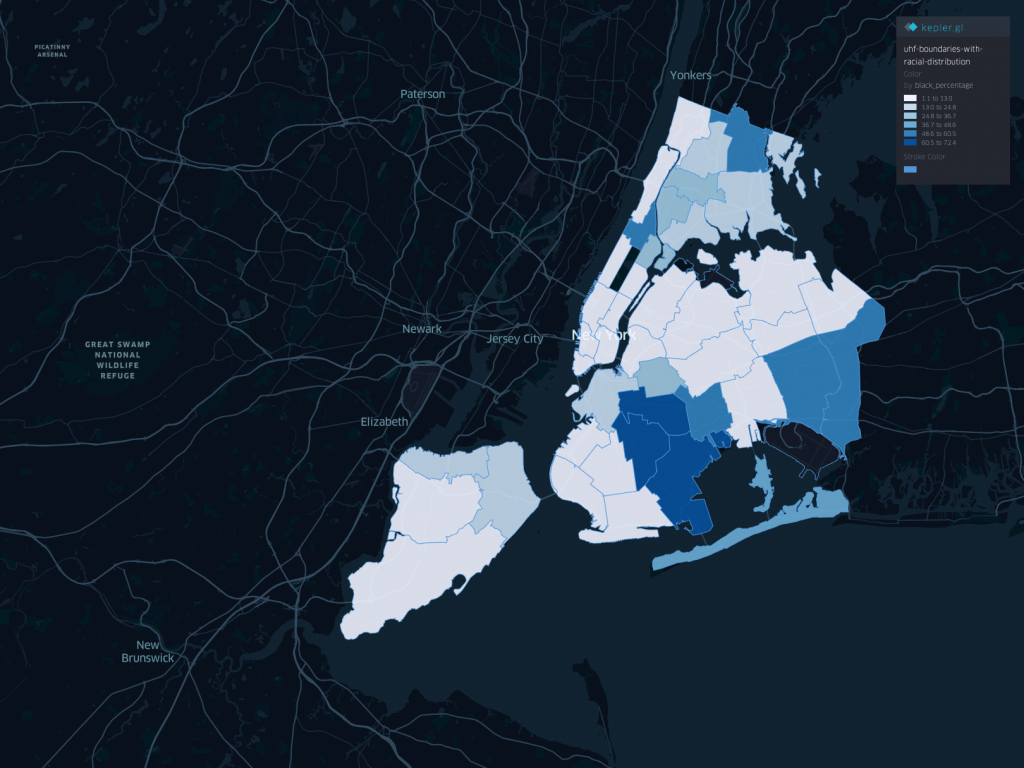
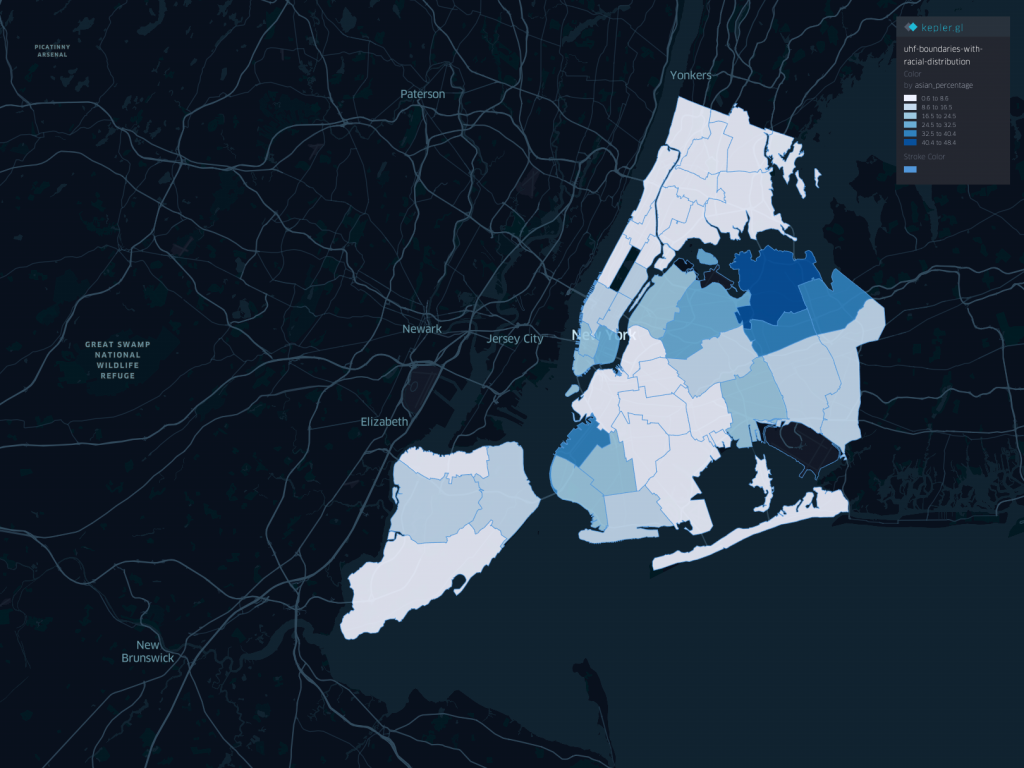
Originally, our idea was to map ethnic restaurants in New York City and find the contrasts and correlations between the racial composition of a certain neighborhood and the availability of ethnic restaurants. We started out by making maps showing the composition of certain races in each neighborhood based on the 2010 US Census.
We then started categorizing restaurants based on their cuisine’s country of origin to determine which ethnicity/race does a specific restaurant caters to. We did our scripting in Node.js, so we created a map mapping each cuisine into a specific ethnicity.
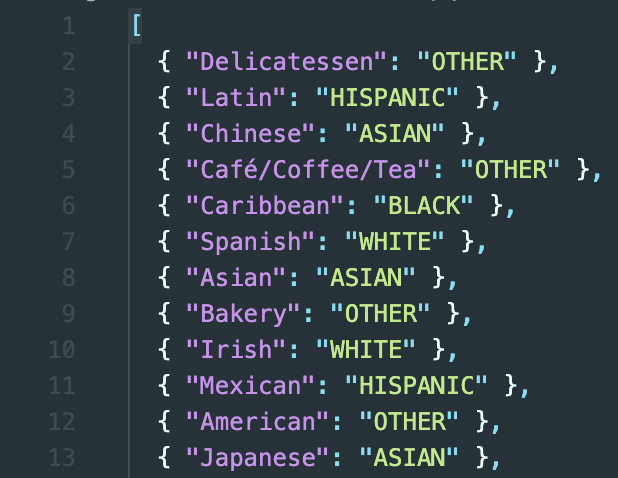
As we do this, this starts to feel more and more wrong. Determining that a certain cuisine’s country of origin directly maps to the color of one’s skin is a gross simplification of something that is nuanced and full of history. Even though we started this with the best of intentions, we decided to not go forward with it. We decided to pivot into mapping the cuisine of New York City.
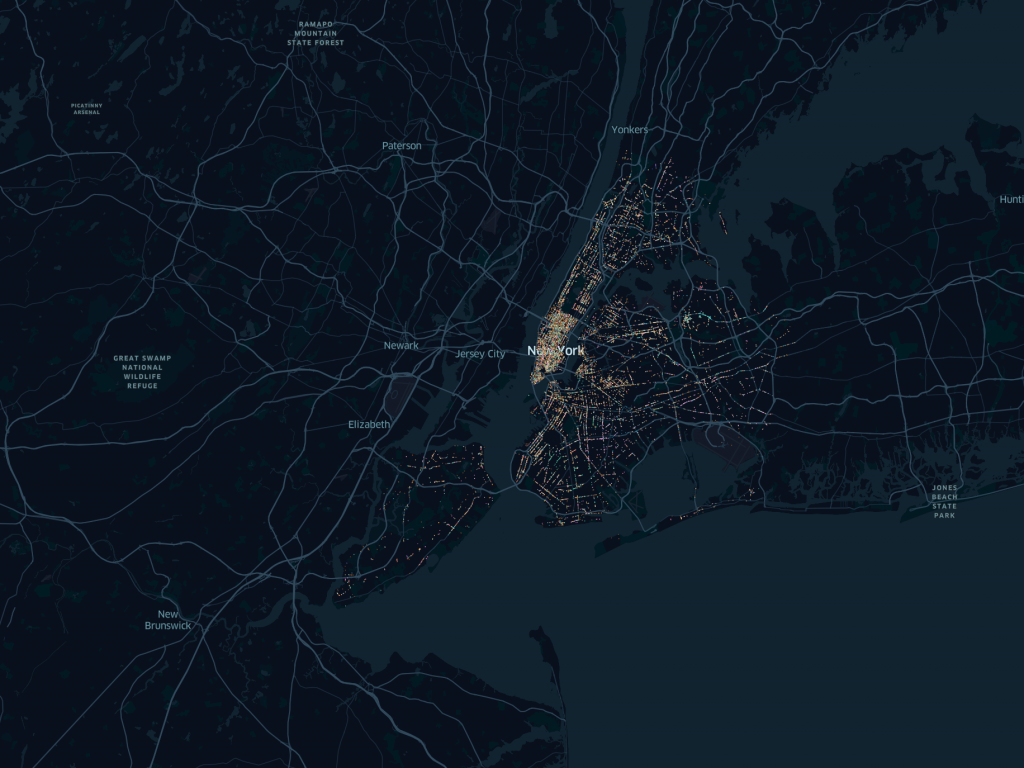
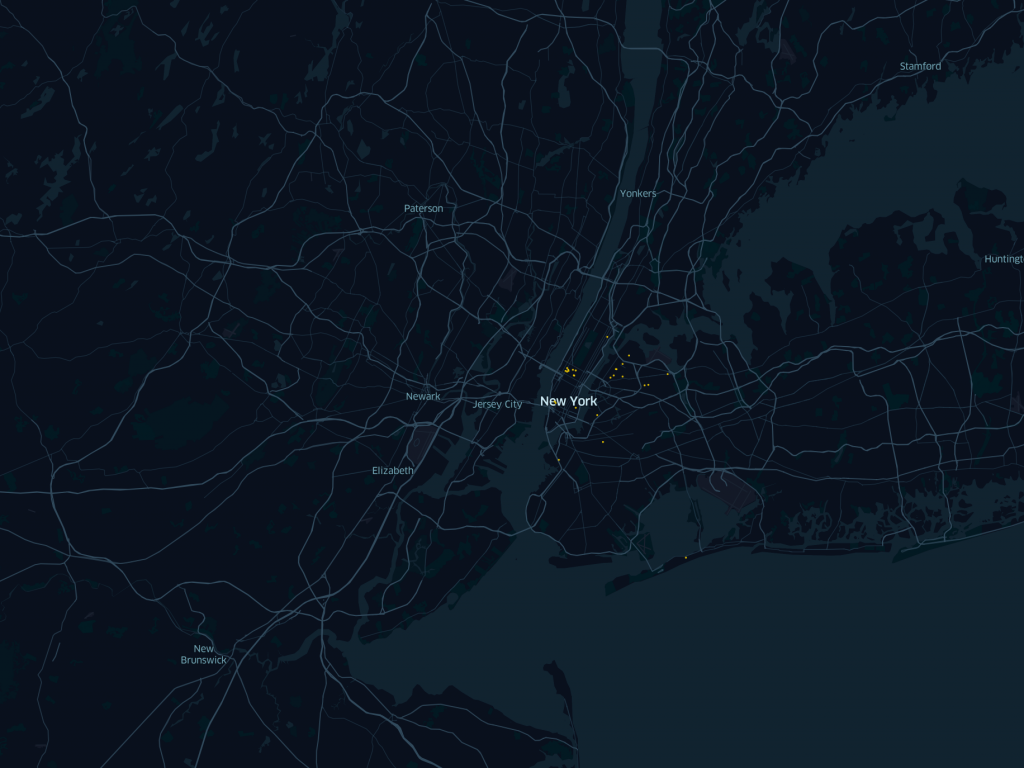
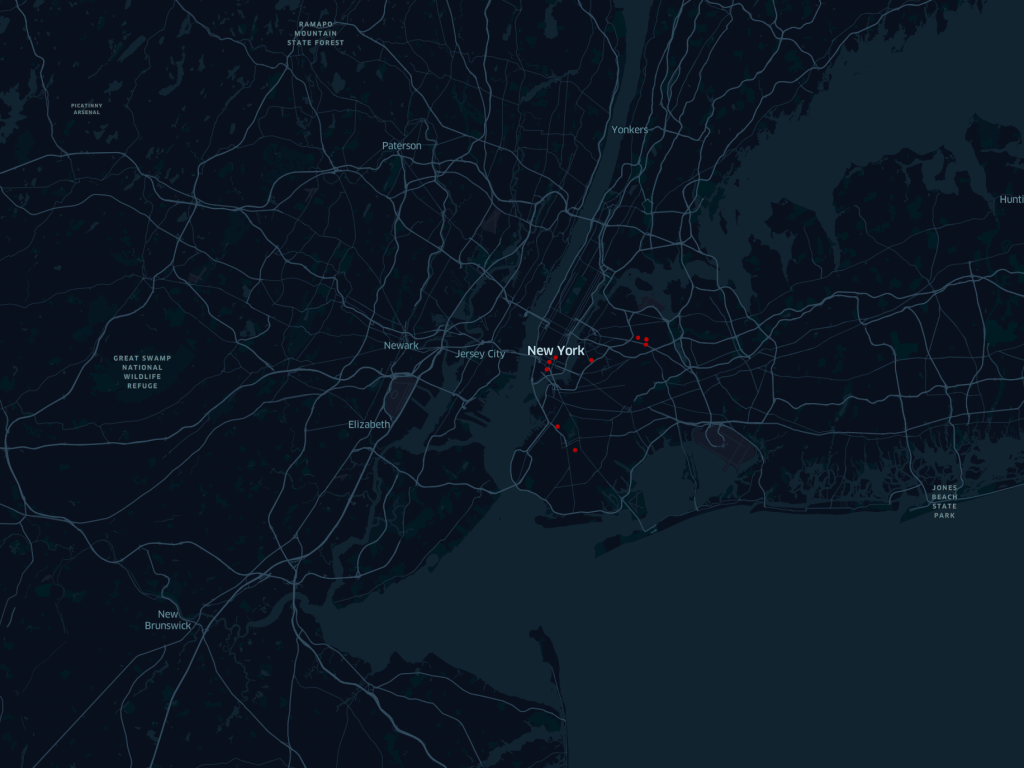
We created a few maps describing the current (as of May 2nd, 2020) state of the available cuisines in New York City.
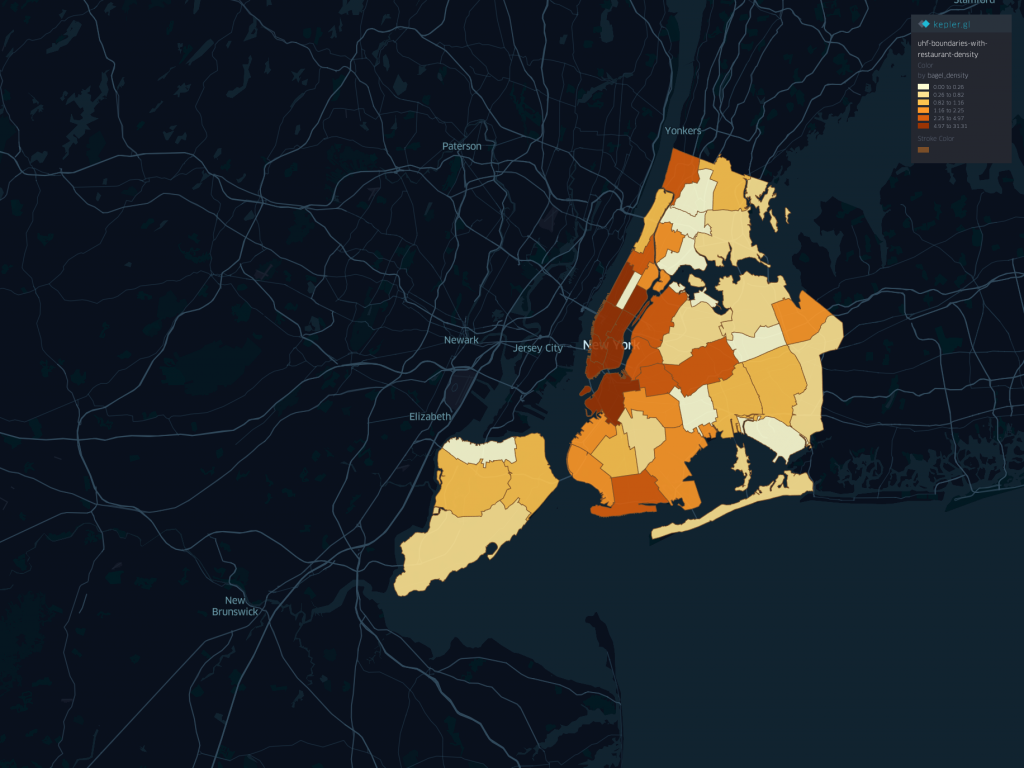
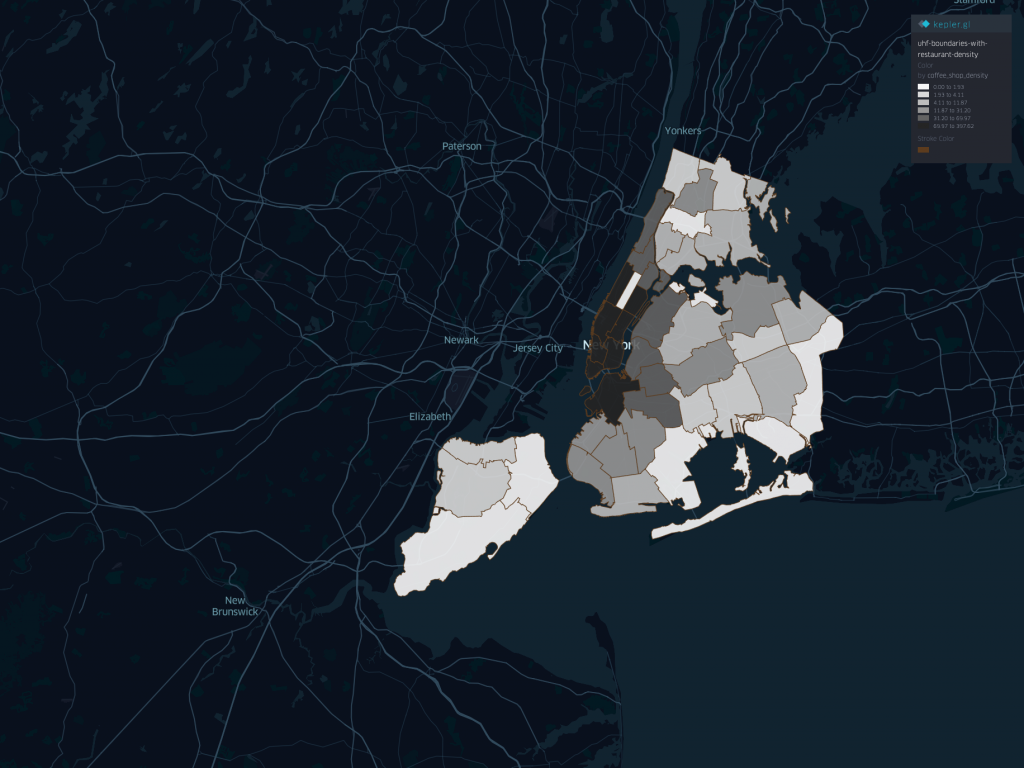
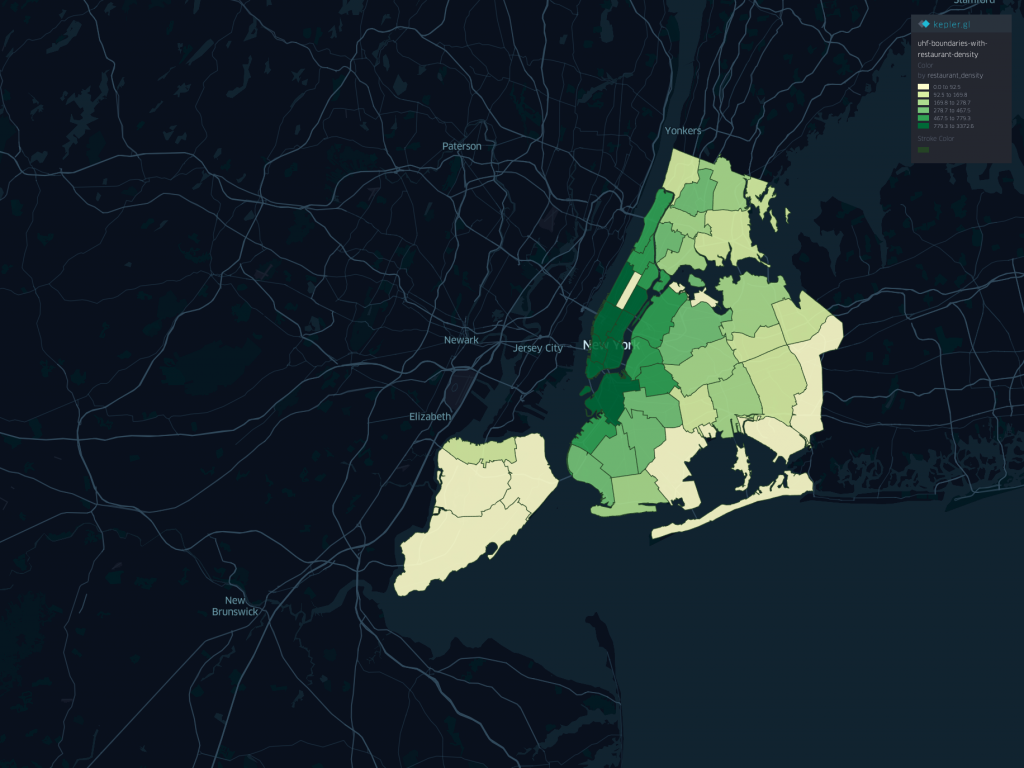
Going back to the idea of analyzing neighborhoods, we then made a map of the density of restaurants of a particular cuisine in each neighborhood. This is done by counting the number of restaurants in each neighborhood, divided by the square footage of said neighborhood. (numbers are displayed as restaurants per 100,000,000 square foot).

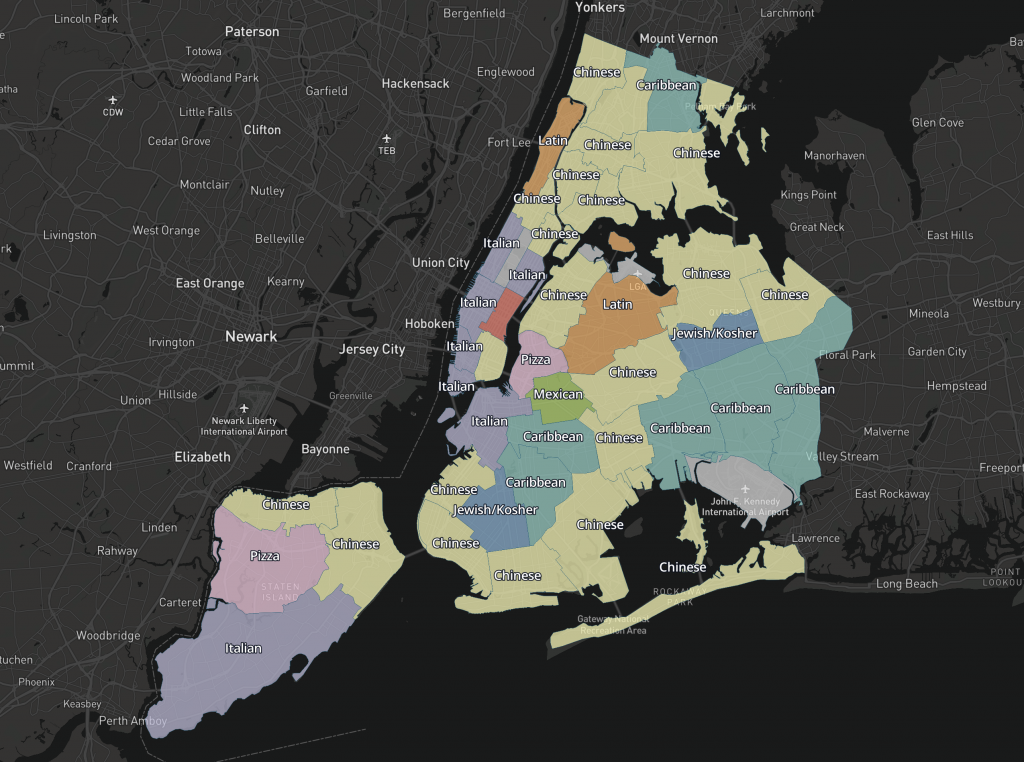
Finally, we moved forward and created a web map showing the most popular cuisine of each neighborhood, along with the number of restaurants of a specific cuisine that exists in each neighborhood. Each neighborhood is colored differently based on the most popular cuisine, and when hovered a popup displays the cuisine breakdown of said neighborhood.
Reflection
To me personally, when I think of the foods of New York, I think of pizza, bagel, and coffee. We find that it is interesting that the most popular cuisine in New York City is indeed Chinese food.
Another thing we found interesting is that the density of all restaurants in NYC inversely matches the density of Hispanic residents. We have yet to determine if this has anything to do with income brackets, education levels, or anything else.
One last note, we feel that it was important to go back to the drawing board once we realize that what we were doing was wrong. Pivoting was definitely the right decision. We encourage all technologists to periodically do a self-sanity-check. Just because we can build something, doesn’t mean that we should.
Data Sources